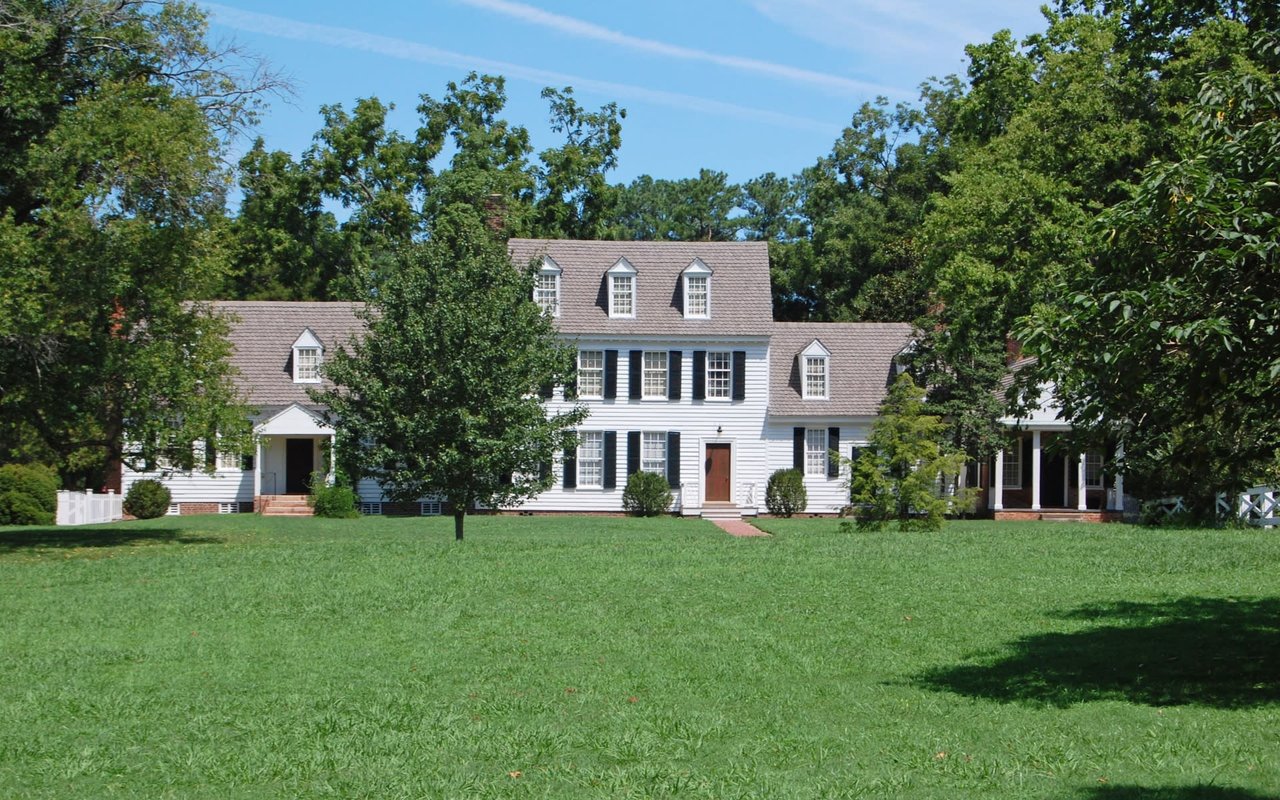
Chartered in 1758, Stephens City — long known as “Newtown” — is one of the oldest towns in the Shenandoah Valley. Today it pairs a historic Main Street with some of Frederick County’s most popular newer neighborhoods, all about five miles south of Winchester. For many buyers, it offers more space and newer homes while staying close to Winchester’s jobs and amenities and within easy reach of I-66.
Drive times vary with traffic and departure time.
Market data changes monthly — we refresh this section quarterly. For your home’s current value, request an Equity Report.
Newer construction and proximity to Winchester’s healthcare, education and federal employers make Stephens City a practical market for long-term rentals. Across the Winchester metro, recent average rents for single-family houses are about $2,070/month for 3 bedrooms and about $2,720/month for 4+ bedrooms (Rentometer, Feb. 2026). Because our team also manages rentals through Covenant Real Estate Management, we can show you what a specific property would realistically rent for — and what ownership actually involves — before you buy, keep, or sell.
Rental figures are metro-area market averages, not a guarantee of rent or return for any property.
School assignments depend on the specific address. Please verify boundaries directly with the school division.
Most agents start with the price. We start with your plan. Let’s talk about your goals, your equity, and your options.
Book a 1-Hour Strategy Meeting · Get Your Equity Report
TGG Homes and Investments · Keller Williams Gateway West · Each office is independently owned and operated.
22,393 people live in Stephens City, where the median age is 38.1 and the average individual income is $43,388. Data provided by the U.S. Census Bureau.
Total Population
Median Age
Population Density Population Density This is the number of people per square mile in a neighborhood.
Average individual Income
There's plenty to do around Stephens City, including shopping, dining, nightlife, parks, and more. Data provided by Walk Score and Yelp.
Explore popular things to do in the area, including Roma Casual Italian & Greek Dining, Starbucks, and Waffle House.
| Name | Category | Distance | Reviews |
Ratings by
Yelp
|
|---|---|---|---|---|
| Dining · $$ | 1 miles | 165 reviews | 4.3/5 stars | |
| Dining | 1.02 miles | 15 reviews | 3.7/5 stars | |
| Dining · $ | 1.04 miles | 29 reviews | 3.1/5 stars | |
| Dining | 1.04 miles | 0 reviews | 0/5 stars | |
| Dining | 1.04 miles | 0 reviews | 0/5 stars | |
| Dining · $ | 1.04 miles | 0 reviews | 0/5 stars | |
| Dining · $ | 1.05 miles | 16 reviews | 1.8/5 stars | |
| Dining | 1.07 miles | 0 reviews | 0/5 stars | |
| Dining · $$ | 1.08 miles | 59 reviews | 2.7/5 stars | |
| Dining | 1.1 miles | 4 reviews | 5/5 stars | |
| Dining · $ | 1.11 miles | 13 reviews | 2.4/5 stars | |
| Dining | 1.11 miles | 4 reviews | 3.5/5 stars | |
| Dining | 1.11 miles | 1 review | 1/5 stars | |
| Dining | 1.11 miles | 2 reviews | 4/5 stars | |
| Dining · $ | 1.12 miles | 13 reviews | 3.4/5 stars | |
| Dining | 1.14 miles | 0 reviews | 0/5 stars | |
| Dining | 1.14 miles | 0 reviews | 0/5 stars | |
| Active | 1.07 miles | 0 reviews | 0/5 stars | |
| Nightlife | 1.14 miles | 0 reviews | 0/5 stars | |
| Beauty | 1.07 miles | 0 reviews | 0/5 stars | |
| Beauty | 1.07 miles | 1 review | 5/5 stars | |
| Beauty | 1.08 miles | 21 reviews | 4.3/5 stars | |
| Beauty | 1.14 miles | 0 reviews | 0/5 stars | |
|
|
||||
|
|
||||
|
|
||||
|
|
||||
|
|
||||
|
|
Stephens City has 8,011 households, with an average household size of 2.79. Data provided by the U.S. Census Bureau. Here’s what the people living in Stephens City do for work — and how long it takes them to get there. Data provided by the U.S. Census Bureau. 22,393 people call Stephens City home. The population density is 632 and the largest age group is Data provided by the U.S. Census Bureau.
Total Population
Population Density Population Density This is the number of people per square mile in a neighborhood.
Median Age
Men vs Women
Population by Age Group
0-9 Years
10-17 Years
18-24 Years
25-64 Years
65-74 Years
75+ Years
Education Level
Total Households
Average Household Size
Average individual Income
Households with Children
With Children:
Without Children:
Marital Status
Blue vs White Collar Workers
Blue Collar:
White Collar: